How to Effectively Measure Customer Loyalty
NPS - Net Promoter Score
NPS is a powerful tool for measuring customer loyalty and their willingness to recommend your product. Originated in 2003, it started with a simple question: "How likely is it that you would recommend our service to colleagues and friends?", rated on a scale of 0 to 10.
Today, NPS has expanded to provide a more complete picture. Examples of additional questions include:
- On a scale of 0 to 10, how likely are you to recommend our product or service to a friend? Example: A customer who loves your service might give a 9, indicating a high likelihood of recommendation.
- What motivated your rating? Example: A customer might mention the high quality of your product as a reason for giving an 8.
- How could we improve our product? Example: A customer suggests increasing the variety of colors in your clothing line.
- What aspects do you think we could improve in our service? Example: A customer recommends shortening wait times in customer service.
- What did you enjoy most about our service? Example: A customer praises the ease of use of your website.
Benefits of NPS for Your Business:
- Large customer base: More reliable data from a base of 1,000 people than 100.
- Customer loyalty: Loyal customers are more likely to respond to surveys.
- Business seasonality: Compare the NPS of your high season against the low season to understand variations better.
- Survey frequency: Monthly surveys allow you to closely follow customer satisfaction trends.
How to Calculate the Customer Satisfaction Index:
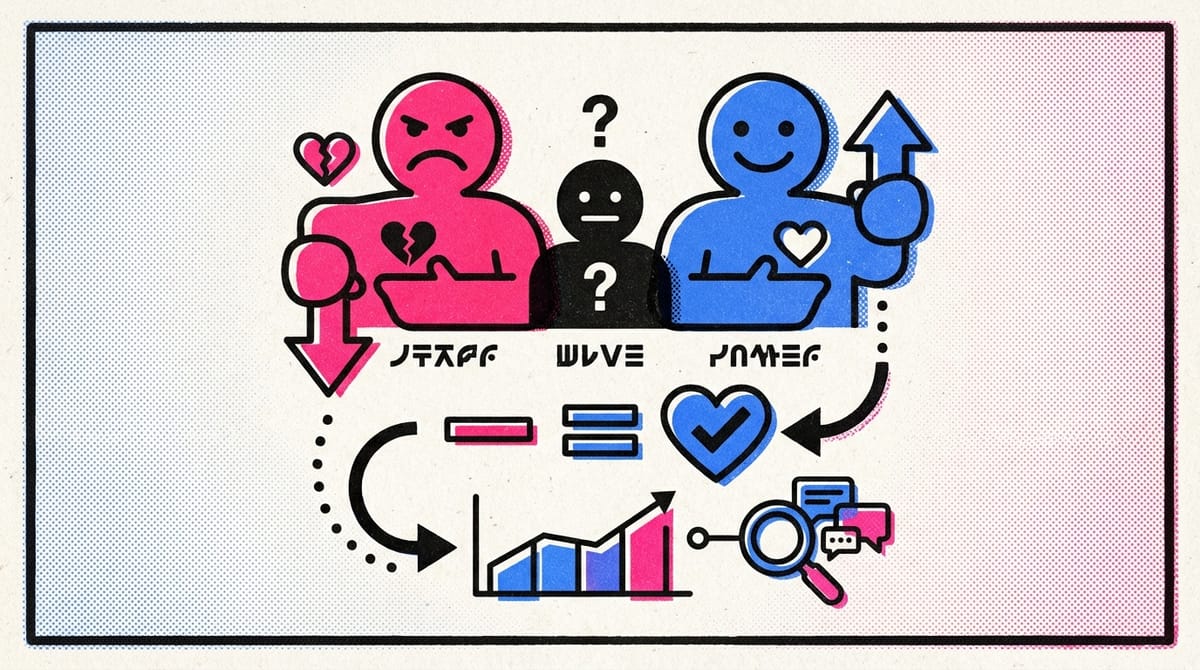
- Promoters (9-10 points): For example, a customer who buys your product monthly and constantly recommends it to friends.
- Passives (7-8 points): A satisfied customer but not actively enthusiastic about your brand.
- Detractors (0-6 points): For example, a dissatisfied customer who expresses their discontent on social media.
☝🏻 The NPS formula: % of promoters - % of detractors.
I have created three tables with relationships, following the rules of database creation. This is useful for teams of any size, from small groups to developing start-ups. I'm not sure how Notion will handle a large number of users. If you work alone or in a small team, it might be easier for you to review these three tables and adapt them to your needs. Anyway, this is just an example that can be used as a starting point and adapted to your needs. Below, I have also given an example of what data to collect and how to work with it. It might be easier for you to create your own table based on this text rather than studying the existing ones. I have also left text examples for collecting and analyzing comments.
1. Introduction Section
- Template Objective: Brief description of what this template is used for.
- Usage Instructions: Simple steps on how to use the template.
2. Feedback Record
- Feedback Table:
- Date Received: Date the feedback was received.
- Feedback Source: e.g., Customer, employee, survey, user testing.
- Feedback Type: e.g., Comment, complaint, suggestion, praise.
- Feedback Description: Specific details of the feedback received.
- Feedback Provider Contact: (Optional) Contact information, if available.
3. Feedback Analysis
- Categorization:
- Category: e.g., Product, customer service, website.
- Subcategory: (If applicable) e.g., Product quality, delivery speed.
- Urgency: Low, Medium, High.
- Follow-up Responsible: Person or team in charge of addressing this feedback.
- Status: e.g., Pending, In Process, Resolved.
4. Actions Taken
- Action Plan: Description of measures taken in response to feedback.
- Implementation Date: When the action was or will be taken.
- Action Results: Impact or changes observed after implementation.
5. Feedback and Continuous Improvement
- Process Observations: Comments on the feedback management process.
- Suggestions for Improvement: Ideas to improve the feedback collection and analysis process.
- Template Review: Date of the last review and updates to the template.
6. Reports and Metrics
- Generated Reports: Links or attached documents with data analysis.
- Key Metrics: e.g., Customer satisfaction rate, response time.