The art and science of presentations
Master the art and science of presentations! Learn effective frameworks, data contextualization, and audience connection for impactful delivery.

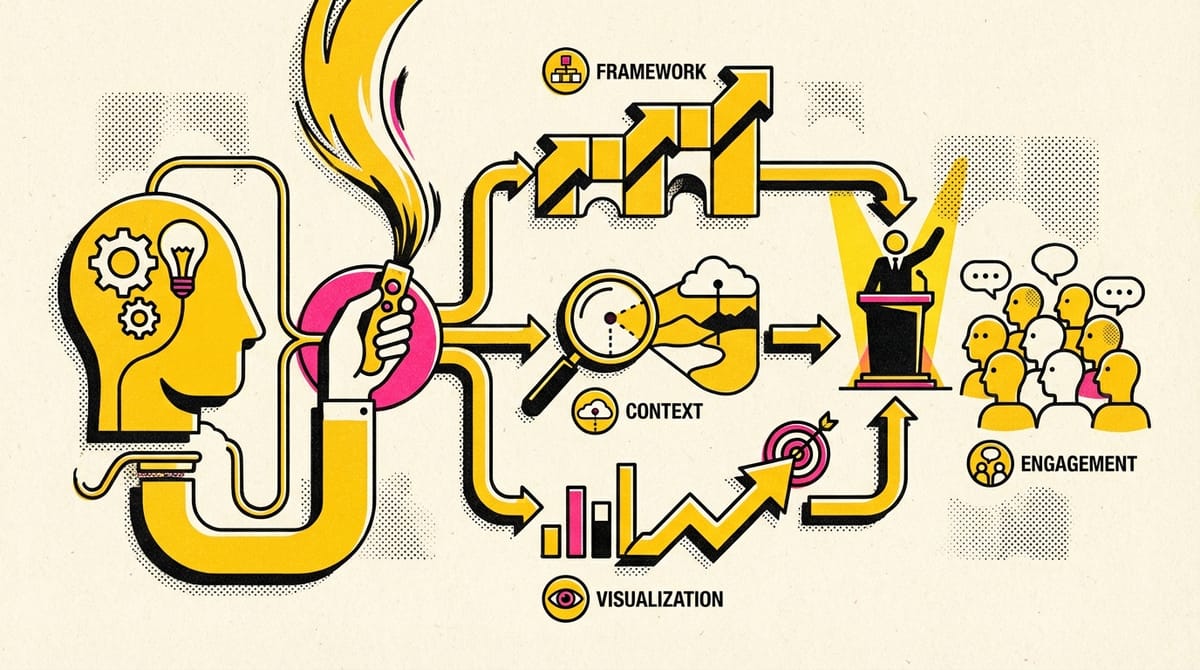
Present with a framework
- Understand the Business Task: Always frame your data presentations around the business task to make your findings more accessible and relevant to your audience.
- Use a Strategic Framework: A well-structured framework helps create logical connections and keeps the presentation focused on key information.
- Outline Goals Clearly: Clearly state the goals and objectives of your presentation at the beginning to set expectations.
- Contextualize Data: Present raw data in context to help your audience make sense of it. Use business metrics to explain the impact of your findings.
- Utilize Speaker Notes: Prepare and use speaker notes to guide your presentation and ensure you cover all critical points.
- Connect with Metrics: Explain the metrics used in your analysis to help your audience understand how the data was measured and its implications.
Weave data into your presentation
- Understanding the data available during collection helps frame the findings.
- Establishing an initial hypothesis provides context for the data.
- Use examples and visualizations to explain solutions to business tasks.
- The McCandless Method helps effectively present data visualizations.
- Introduce the graphic by name.
- Answer obvious questions before they arise.
- State the insight the data provides.
- Call out data to support the insight.
- Explain why the insight matters and its potential business impact.
- Always ensure data points and charts support the main takeaway.
Review a slide presentation
Your evaluation criteria
- Include a title, subtitle, and date: Ensure your slide deck has a title, subtitle, and date so your audience knows what you are presenting and when the information is from. That way, they know it’s relevant and current!
- Use a logical sequence of slides: Organize your slides in an order that makes sense to guide your audience through your narrative, building understanding step by step.
- Provide an agenda with a timeline: An agenda offers a roadmap of your presentation, allowing your audience to follow along and anticipate key topics.
- Limit the amount of text on slides: Keeping text brief ensures clarity and retains the audience’s attention; aim for your audience to scan it within 5 seconds.
- Start with the business task: By immediately relating the content to the business task at hand, you contextualize your information, making it relevant and actionable.
- Establish the initial hypothesis: Presenting an initial hypothesis gives your audience a starting point for what to expect and frames the subsequent analysis.
- Show what business metrics you used: Clarifying which metrics you're analyzing validates your arguments and helps the audience gauge your presentation's relevance to business outcomes.
- Use visualizations: Visual aids can illustrate complex data more effectively than text alone, making your message more accessible.
- Introduce the graphic by name: A brief introduction to each graphic aids in understanding and retaining information.
- Provide a title for each graph: Titles act as signposts, helping the audience quickly grasp the meaning of each visual.
- Go from the general to the specific: Starting with a broad overview before diving into details ensures that all audience members are on the same page.
- Use speaker notes to help you remember talking points: Notes act as your cue cards, enabling a smoother delivery and ensuring no critical point is missed.
- Include key takeaways: Summarizing the main points at the end of your presentation reinforces the message and ensures the audience leaves with the intended takeaways.
Like so many parts of your job as a data professional, creating presentations is an iterative process. Reviewing your work, making changes as needed, and improving it when you can will make your presentations clearer and more useful for stakeholders.
Create an evaluation table
Now that you understand the best practices for slide presentations, organize your reviews using an evaluation table. An evaluation table essentially gives you a checklist for each slide in a presentation so you can identify any changes that need to be made in an organized fashion. The evaluation table should have a column for the slide number, a column for notes on what worked well, and a column for what could be improved. Here’s an example of a blank evaluation table:
You can use evaluation tables to note things you liked about a presentation as well as things you would like to improve!
Key takeaways
Refining your skills in evaluating slide decks is an evolving journey. Each aspect of your presentation—from a concise title to a coherent sequence of content, and the conciseness of your text to the accuracy of your visuals—is intentionally designed to elevate the audience's understanding and interest. Documenting your progress and taking time for reflection supports your development and is fundamental to communicating complex data in a clear, impactful narrative. This will also improve your presentation skills for the future!
- Effective Presentations: Ensure your slide presentations are clear, concise, and well-organized to convey your findings effectively.
- Evaluation Criteria: Use best practices such as including titles, logical sequence, limited text, and visualizations to enhance your presentations.
- Iterative Process: Continuously review and refine your presentations to improve clarity and utility for stakeholders.
- Evaluation Table: Utilize an evaluation table to systematically review and improve each slide in your presentation.
- Continuous Improvement: Embrace the evolving nature of presentation skills and document your progress for future growth.
Presentation skills for new data analysts
- Keep it simple: Ensure that your presentation is straightforward and easy to understand for all audience members.
- Avoid "eyesore charts": Use clean, clear visuals that effectively communicate your data without overwhelming the audience.
- Make it fun: Engage your audience with interactive elements such as games, quizzes, videos, or questions.
- Utilize storytelling: Connect with your audience through compelling stories to make your presentation more engaging.
- Have an ally: Present your content to a trusted colleague beforehand to gather feedback and gain support during the actual presentation.
- Persistence pays off: Convincing others may require multiple attempts, but perseverance can lead to successful outcomes.
Critique of a presentation
Messy example of a data presentation
- Lack of Structure: The presentation lacked a clear structure, including an introduction, purpose statement, and logical flow throughout the slides.
- Overloaded Slides: Slides were overloaded with text and visuals, making it hard for the audience to focus.
- Missing Titles: Many slides lacked titles or subtitles, which are essential for guiding the audience's understanding.
- Inconsistent Themes: Visuals and text placement were inconsistent, which disrupted the flow and familiarity for the audience.
- Conclusion Slide: The conclusion slide was present but did not effectively summarize the presentation or guide the audience to the final takeaway.
- Audience Focus: Important to guide the audience's focus and comprehension by directing their gaze and explaining visuals clearly.
Good example of a data presentation
- Simplify Your Slides: Begin with a simple title slide and make sure to include the date to provide context for future reference.
- Tell a Story with Your Data: Structure your presentation as a story, starting with a purpose statement, followed by the main content, and concluding with clear recommendations.
- Use Visuals Effectively: Introduce your data visually, explain the visuals in detail, and use annotations and animations to guide your audience's attention.
- Keep Text Minimal: Only use concise text to highlight key points, ensuring your audience focuses on listening to your explanation.
- Explain Technical Concepts: Clearly explain any technical components, such as correlation coefficients, to ensure all audience members understand.
- Ensure Smooth Transitions: Provide clear transitions between slides to maintain the flow of your presentation.
- Practice Data Storytelling: Use your unique presentation style and skills to make the data engaging and understandable.
- Highlight Findings Clearly: Summarize your key findings in the conclusion, and address any need for further analysis or caveats.
- Encourage Questions: Be prepared to answer questions and engage with your audience at the end of your presentation.
As always, I invite you to share your opinion in the comments
With love 😽 🤗 😘
K