The OSEMN Framework
Master the OSEMN Framework to streamline your data analysis process. Improve accuracy and efficiency with actionable insights in every stage!


- Data analytics involves multiple steps, such as collecting, cleaning, categorizing, analyzing, and interpreting data.
- The large volume of data available can make the job of a data analyst overwhelming.
- A framework can help data analysts organize their work processes and strategies.
- Using a framework ensures accuracy and consistency throughout the data analysis process.
- The lesson introduces a helpful framework known as the "awesome framework" for approaching data analysis.
OSEMN Framework
- The OSEMN framework is a helpful structure for organizing data analysis projects.
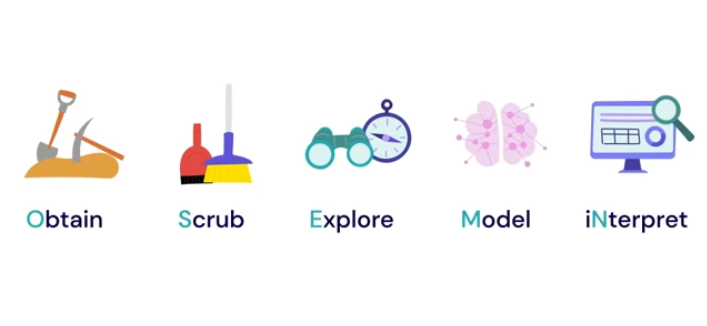
- OSEMN stands for Obtain, Scrub, Explore, Model, and Interpret.
- Each stage has specific tasks and goals that contribute to the overall analysis.
- The framework helps break down large tasks into manageable pieces.
- It is adaptable to various types of data and business questions.
- Understanding and applying each stage will improve the effectiveness of data analysis projects.
Start with a Goal in Mind
- Understand Business Goals: Before starting an analytics project, it's crucial to understand the business goal related to your task.
- SMART Goals: Goals should be Specific, Measurable, Achievable, Relevant, and Time-bound.
- Specific: Be clear about what the business is trying to achieve.
- Measurable: Ensure the goal can be evaluated in a quantifiable way.
- Achievable: The goal should be realistic and attainable.
- Relevant: Goals should align with the greater business strategy.
- Time-bound: Set a clear start and end date to track progress.
- Formulating Objectives: Once a SMART goal is set, it becomes easier to formulate the objectives for your analysis.
- KPIs: Key Performance Indicators will help evaluate whether a goal was achieved.
Understand the KPIs
- SMART Goals: Setting a SMART goal helps in clearly defining the objective. A SMART goal should be Specific, Measurable, Achievable, Relevant, and Time-bound.
- KPIs: Key Performance Indicators are measurable values that help track progress towards a goal. They are quantitative, directional, and directly related to the goal.
- Primary vs. Secondary KPIs: Primary KPIs directly measure progress towards the goal, while secondary KPIs correlate with primary KPIs but do not fully confirm goal achievement.
- Focus on Relevant Data: KPIs help analysts focus on the most critical data, preventing them from getting overwhelmed by the sheer volume of available information.
- Application in Business: Understanding and applying KPIs can help businesses, like Calla & Ivy, to measure success and make informed decisions.
Example
- Setting a SMART goal and understanding associated KPIs are crucial for the success of an analytics project.
- The OSEMN framework provides a systematic approach to data analysis, which can improve the accuracy of results.
- Imra's flower shop, Calla & Ivy, used a social media advertising campaign to achieve their goal of 10,000 website visits in May, surpassing it with 13,457 visits.
- Sheila, a data analytics intern, used the OSEMN framework to obtain, scrub, explore, model, and interpret data to evaluate and improve the campaign's success.
- Data from different sources like Google Analytics, Instagram Ads Manager, and TikTok was crucial for Sheila's analysis.
- Sheila's analysis suggested reallocating some advertising budget to TikTok, predicting a 35% increase in website visits for June.
- The insights derived from data analysis can significantly influence decision-making and strategy adjustments.
- The OSEMN framework's structured approach helps in tackling various steps of data analysis efficiently.
Overview
- The OSEMN Framework provides a structured approach to data analysis.
- It consists of five main stages: Obtain, Scrub, Explore, Model, and iNterpret.
- Obtain focuses on gathering relevant and available data.
- Scrub involves cleaning and preparing the data for analysis.
- Explore emphasizes searching for patterns and conducting statistical tests.
- Model involves selecting and applying appropriate analytical models.
- iNterpret focuses on communicating results through visualizations and presentations.
- This framework ensures a comprehensive and systematic approach to data analysis projects.